


To design, the Layout of the charts follow the below steps.
Login to Backend
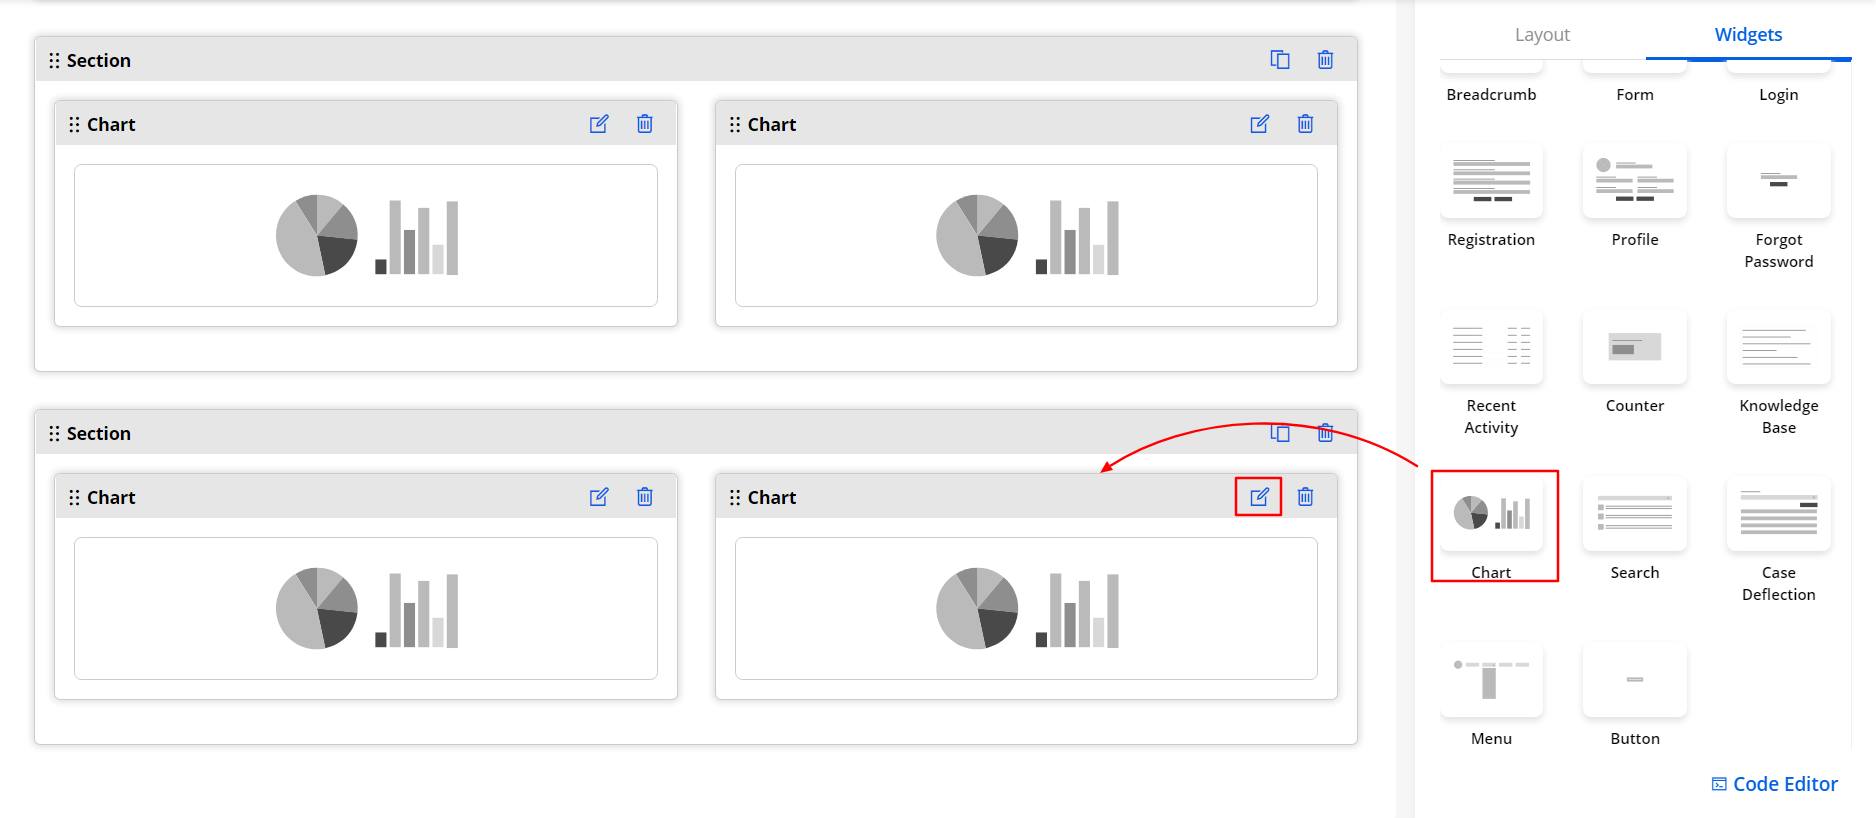
Navigate to the Design ➤ Page Builder, you will get the list of Pages. Now create the new page by clicking the “Create” button. You just have to drag and drop the “Chart” widget to the Layout area and click on the Edit button to select the layout.
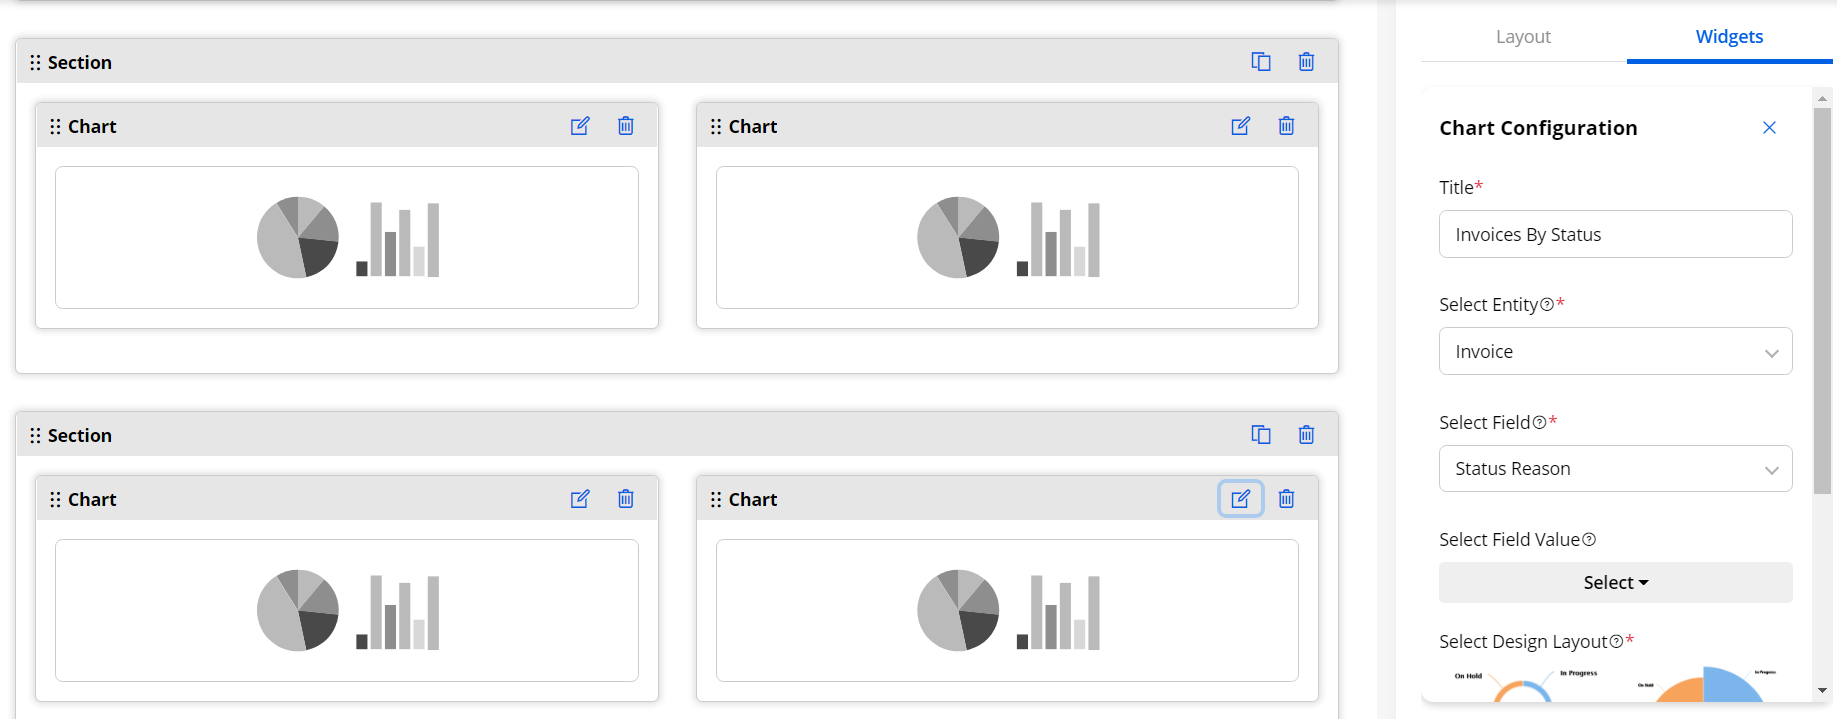
If you want to display the analytics in Charts by selecting the Entity & its specific field, you need to configure the following details:
Title: Insert the relevant Chart Title. i.e., Total Cases and In Progress cases.
Select Entity: Select the Entity from the list. i.e., Account, Case, Attachment, Contract, Call, and Order.
Select Field: As per the Entity selection, the Fields will be fetched which needs to be selected.
Select Field Value: Select the field value of the entity that you want to display in the chart.
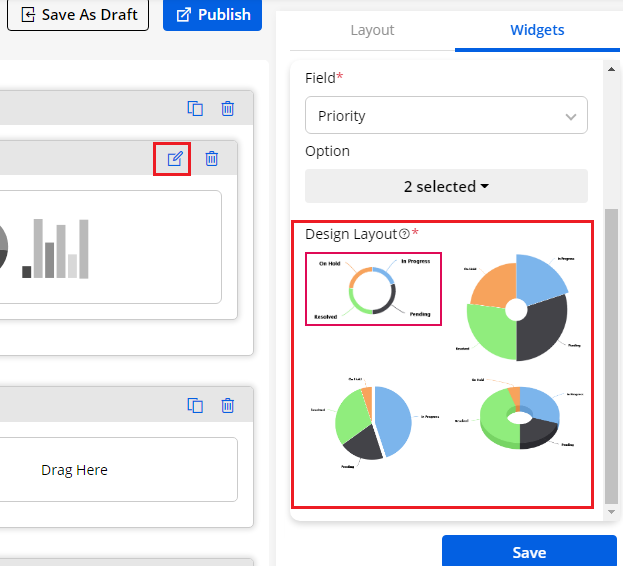
Design Layouts: By scrolling down, you will get the 4-predefined Design Layouts to select the appearance of the chart in the customer portal. By clicking on the design, you will get a preview of the design and you can select the one as per your requirement and click on save button to save the configurations made.
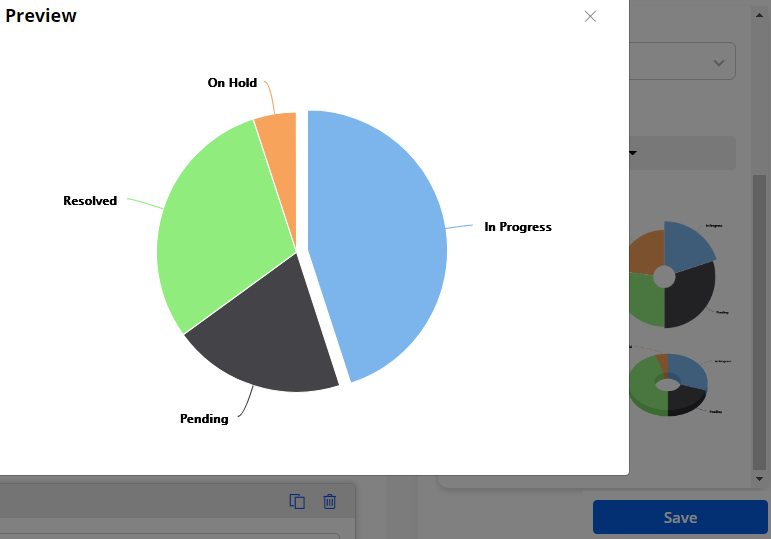
Preview of User Side
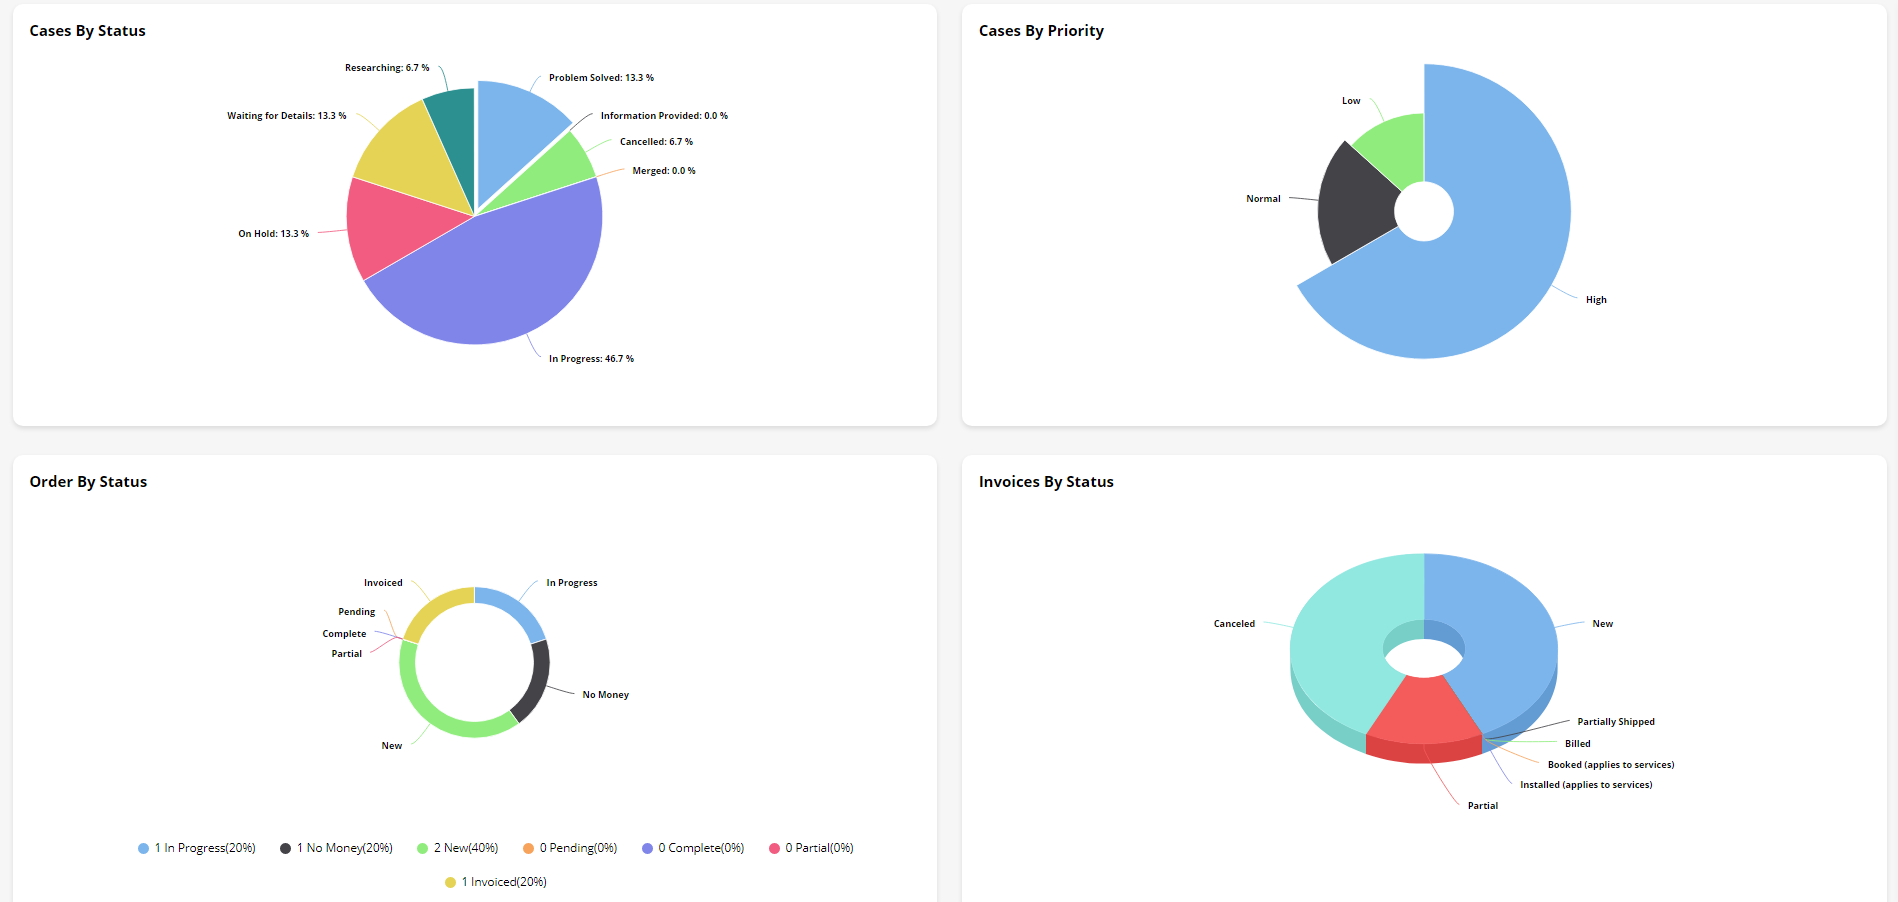
As in the above configuration, you can see we have added four charts so the customer portal will display the charts as per the configurations.